
Advanced data analytics models, combined with AI, are revolutionizing the public transit sector by shifting from rigid schedules to dynamic, data-driven networks. Modern analytics dashboards, in particular, are critical for helping transport authorities transform raw operational data into real-time, actionable intelligence. These interactive dashboards act as a centralized command center for public transit agencies by unifying fragmented data sources, such as vehicle tracking, ticketing, and maintenance logs, turning them into comprehensible visual metrics. This enables agencies to optimize scheduling, improve overall fleet performance, forecast maintenance needs, and elevate the passenger experience, all while keeping costs down.
In this article, we’ll examine some of the core functions of modern analytics in public transit, their benefits, and why they are considered a good investment for agencies looking to elevate their operations.
Understanding The Core Functions Of Advanced Analytics In Public Transit
Public transport authorities can apply advanced analytics to convert raw fleet, ticketing, and passenger data into easy-to-understand, actionable insights. By offering a unified view of operations and performance metrics, these solutions empower agencies to optimize daily operations, boost on-time performance, and allocate resources more efficiently. Data dashboards integrate core systems, such as Computer-aided Dispatch (CAD) and Automatic Vehicle Location (AVL), alongside contactless fare collection and maintenance, combining them into a single interface. This allows transit operators to monitor vehicle locations, route performance, and sales in real-time, enabling immediate operational adjustments. Instead of relying on static, historical spreadsheets, agencies can use dynamic filtering and forecasting to identify ridership trends, optimize routes, and anticipate network demand. By observing telemetry data from transit vehicles (e.g., engine temperature, battery health, mileage), dashboards can effectively predict component failures before they happen, keeping vehicles out of the repair shop and on the road.
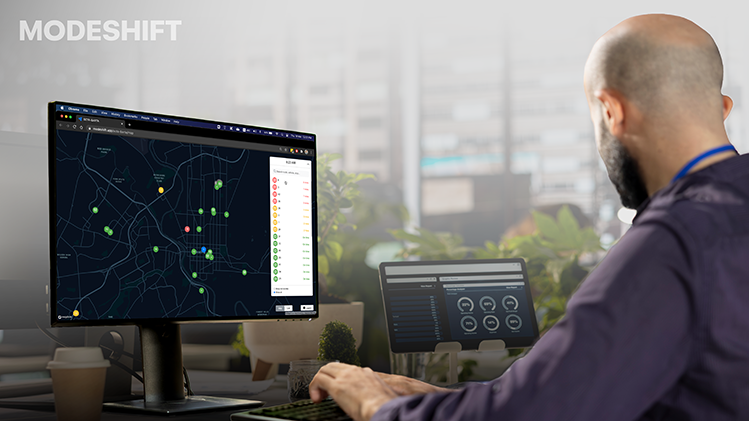
Tracking Automatic Vehicle Location (AVL) and Automatic Passenger Counter (APC) data in real time further helps mitigate bottlenecks and adjust schedules during peak demand. By combining it with AI video analytics and fare-collection data, authorities can monitor passenger loads across specific modes, allowing for the dispatch of additional buses or trains to high-density routes to prevent overcrowding. Tapping data across buses, trains, and bikes also helps agencies to synchronize timetables and cap fares dynamically. Advanced reporting tools found in dashboards leverage data analytics to translate commuter habits into concrete environmental metrics. By integrating active travel tracking and ridership data, these systems calculate displaced vehicle miles traveled, enabling agencies to quantify greenhouse gas reductions and promote sustainable urban mobility. Agencies can further utilize advanced analytics to fine-tune how they provide real-time traveler information. Dashboards feed real-time data into passenger apps and station signs, delivering highly accurate estimates that reduce rider anxiety.
Utilizing The Power Of Cloud-Based Predictive Models
Cloud-based systems are the backbone of modern transit analytics as they deliver the real-time scalability, processing power, and integration required to manage massive volumes of transit data. These solutions empower agencies to optimize routes, predict delays, and lower infrastructure costs, which are capabilities that on-premise systems simply cannot match. By aggregating real-time ticket validations, GPS positions, weather conditions, and local event calendars, predictive models forecast when and where overcrowding will occur, allowing agencies to deploy additional buses or trains. Cloud environments further support dynamic traffic and schedule adjustments by processing live traffic data to anticipate delays and adjust traffic signals (e.g., giving green lights to approaching, delayed buses). This allows authorities to instantly update passenger-facing digital signage and apps with accurate arrival predictions. Additionally, cloud platforms stream IoT sensor data directly from active vehicles to track component wear and tear. This shifts maintenance from a reactive schedule to a proactive one, predicting failures (such as engine or brake issues) before they happen and preventing costly service disruptions.
Cloud solutions essentially provide transit agencies with “infinite scalability” by supplying the elastic computing power to process billions of data points without requiring expensive physical hardware. Agencies can instantly scale compute resources to handle spikes in data (e.g., millions of daily tap-ins or real-time GPS pings across a city’s vehicle fleet), regardless of service demand, time of day, or seasonal changes. This allows them to handle intense data processing loads without crashing or requiring expensive on-site servers while also running complex, real-time predictive models. Cloud machine learning platforms, such as Microsoft Azure Machine Learning, offer on-demand access to these heavy-duty processors, allowing algorithms to train on billions of data points without overwhelming local transit agencies. Furthermore, serverless computing means agencies do not have to predict their hardware needs in advance. Instead of paying for expensive, oversized servers, agencies use a “pay-as-you-go” operational model. The processing power dynamically adjusts to the exact computational demands of an agency’s network and predictive algorithms, charging them only for what they have used.
Why Should Public Transport Agencies Invest In A Comprehensive Analytics Suite?
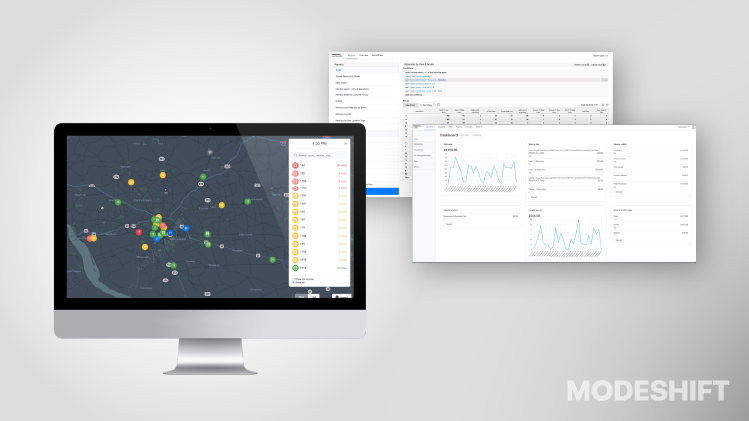
Modern analytics suites provide public transport agencies with a comprehensive, real-time overview of their networks, enabling them to break down departmental silos and aid their day-to-day decision-making. Combining real-time IoT feeds, ticketing data, and GPS tracking into a centralized, map-based interface enables agencies to dynamically synchronize schedules, track assets, predict maintenance, and optimize passenger flow across buses, light rail, subways, and micro-mobility options. By visualizing the entire multimodal network, dispatchers can monitor vehicle dwell times and adjust schedules so that bus arrivals perfectly align with train departures, minimizing passenger wait times. Analytics suites can also integrate with municipal traffic cameras to give buses and trams priority at intersections, significantly reducing travel times and improving schedule reliability. By continually monitoring fleet telemetry and equipment performance, predictive analytics can detect anomalies before they lead to breakdowns, minimizing service disruptions. Modern analytics combine census data, GPS tracking, and historical ridership trends to identify underserved areas and model new transit lines, ensuring new infrastructure directly serves population centers with the highest demand.
Modern analytics suites are also vital for future Mobility-as-a-Service (MaaS) integration. They help aggregate fragmented datasets from public transit, ride-sharing, and bike rentals into real-time insights. This transparency is critical to ensuring public transport authorities allocate resources precisely where they are needed while breaking down silos within these broader multimodal ecosystems. Furthermore, advanced analytic models synchronize cross-provider transactions, enable dynamic pricing, and automate revenue sharing. This enables the automatic distribution of fares among transit agencies, ride-sharing apps, and micro-mobility operators, simplifying complex billing operations. By analyzing real-time demand and historical usage, systems can adjust travel prices on the fly, balance network capacity, and incentivize specific traveler behaviors. Integrating data with advanced analysis tools also enables public transit authorities to track whether private MaaS operators are meeting service level agreements (SLAs) and broader municipal mobility goals.
Real-World Examples Of Data Analytics Platforms In Public Transportation
Several public transit agencies use advanced data analytics to optimize routes, improve on-time performance, and increase operational transparency. By integrating live GPS, ticketing, and sensor data, they deliver actionable insights to both transit managers and the public. In the UK, Transport for London (TfL) uses a massive Unified Open API platform to power internal and external data dashboards. The agency monitors multimodal service statuses, live bus and Tube arrivals, and disruption tracking. Planners also map traffic flows and pedestrian crossing timings against historical datasets to improve intersection safety and air quality. In the U.S., the Metropolitan Transportation Authority (MTA) operates public-facing performance dashboards to track customer-focused Key Performance Indicators (KPIs) such as Wait Assessments and Excess Wait Times. The dashboards detail exactly how many trains or buses reach their destinations on time, identify maintenance needs, and monitor network-wide recovery patterns across the five boroughs.

The Capital District Transportation Authority (CDTA) in Albany, U.S., also launched an analytics platform called TransDASH to keep passengers and taxpayers informed about the value and efficiency of their transit system. The platform updates regularly with data relating to community value, rider connectivity, network accessibility, and service reliability, all based on frequent customer surveys. The Massachusetts Bay Transportation Authority (MBTA) is another example of an agency that maintains an award-winning open data portal and dashboard dedicated to transit reliability. Managers analyze longitudinal travel times, schedule adherence, and vehicle crowding to optimize resource allocation and scheduling. Several transit agencies and authorities also rely on interactive data tools to organize and publish their performance. This includes the National Transit Database (NTD), which U.S. agencies use to analyze performance benchmarks. The General Transit Feed Specification is yet another open-data format used by thousands of providers to feed tracking and alert data into transit dashboards. In the UK, the Bus Open Data Service (BODS) requires operators to publish location, timetable, and fare data, which feeds into wider regional mobility analytics.
In Conclusion
Modern analytic solutions solve multiple issues for public transit agencies by integrating real-time telematics, maintenance, and route data into unified control centers. When manual processes are replaced with automated Key Performance Indicators (KPIs), authorities can observe fleet inefficiencies and make decisions based on precise, accurate data. Dashboards track real-time driving habits such as hard acceleration, harsh braking, and excessive speeding. Agencies can utilize these metrics to coach drivers, saving an estimated $120,000 to $250,000 annually per large district in wasted fuel. Tracking a bus fleet’s idle-time percentage further enables transport companies to pinpoint routes or drivers with excessive stationary runtimes. Identifying and eliminating these bottlenecks can help reduce total fuel consumption by 8-15%. For agencies with electric or hybrid vehicles, dashboards can integrate with charging systems to monitor kilowatt-hours per mile (kWh/mi), ensuring charging routines are cost-effective. Clear performance metrics generated by dashboards also provide a straightforward mechanism to share system performance, reliability, and accessibility metrics directly with stakeholders and the public.
It’s also worth noting that many government grants and federal stipends are directly tied to precise passenger numbers and technology modernization. When Automated Passenger Counters (APC) are siloed from CAD/AVL and scheduling software, agencies underreport ridership data, causing them to miss out on millions in federal funding. In cities like Philadelphia, fares account for up to 37% of the total operating budget. Disconnected fare collection systems prevent real-time data triangulation with passenger counts, making it impossible to detect fare evasion. This results in millions of unrecovered leaks each year. Security modules in analytic suites further use computer vision to monitor turnstiles, emergency gates, and boarding areas. Analytics tools integrated into mobile ticketing apps process travel data to identify suspicious activity, such as users frequently tapping off early to avoid distance-based fare charges. Instead of random checks, analytics systems correlate fare evasion data with ridership patterns, time of day, and specific stops to calculate a “fare evasion risk index”. This allows transit authorities to deploy revenue protection strategies for current and future scenarios.


